
 Back to blog


I run done-for-you Google Ads for ecommerce brands, mostly stores doing between half a million and ten million a year. The question I hear most is: I raised my ad budget, revenue went up, so it’s working, right?
Not always. The gap between “revenue went up” and “the business actually grew” is where a lot of ad money disappears.
You raise your Google Ads budget, revenue climbs, and the reports look good. But a good ROAS does not always mean growth. Brand searches, remarketing, and repeat buyers can make an account look stronger than it is. You may be spending more without actually winning more new customers, and the dashboard won’t tell you.
The question that cuts through the noise: As Google Ads spend rises, do new customers rise with it? And what happens to the cost of acquiring each one?
Go Beyond the Article
Watch the five-minute walkthrough: the exact prompts, and all three store reads on screen.
The One Relationship That Matters
Most owners steer by ROAS because it is the number Google puts in front of them. But ROAS tells you how efficient your spend was, not whether the business actually grew.
New customers tell you that. So the calculator compares three things over twelve months: ad spend, new customers, and customer acquisition cost. Then it looks for two signals.
First, do new customers rise with spend? If you spend more and acquire more customers, you are scaling. If spend rises while new customers stay flat, Google Ads may be taking credit for demand that already existed.
Second is marginal cost: what your newest customers cost compared with your average. Your average acquisition cost can still look healthy while new customers are getting more expensive. Marginal cost catches that earlier, before you overspend.
How to Fill It In Without a Spreadsheet
You need twelve months of ad spend and new customers, plus your gross margin. Collecting it manually is tedious, so I use the AI tools already built into Google Ads and Shopify.
In Google Ads Advisor, I ask for monthly spend across all campaigns for the last twelve full months. In Shopify Sidekick, I ask for new customers over the same period. I screenshot both tables, drop them into ChatGPT with the calculator’s prompt, and get a link to the completed results.
It takes about five minutes. Everything runs in your browser, nothing gets uploaded, and you get a verdict, a chart, and a “room to grow” read comparing customer acquisition cost with what each customer is worth.
Store One: Real Growth
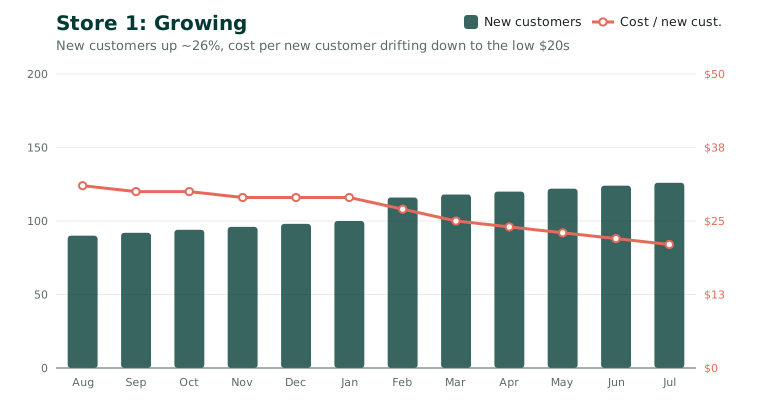 New customers climb through the year while the cost to get one drifts down. Spend rising, customers rising faster.
The first store spends around $3,000 a month, with no seasonality or heavy promotions, so the calculator gets a clean read.
The verdict: “Growing.” Spend increased about 18%, while new customers grew 26%. Average acquisition cost was $29, but marginal cost, what the newest customers cost, was just $21.
That’s healthy scaling: spend went up, new customers grew faster, and the additional customers came in cheaper. With a 12-month customer value of about $111 against a $29 acquisition cost, there was still “Room to grow.”
The move here is to keep scaling, but watch marginal cost. If it starts climbing above the average, don’t keep raising the budget just because the verdict still says “Growing.”
Store Two: A Pullback That Was the Plan
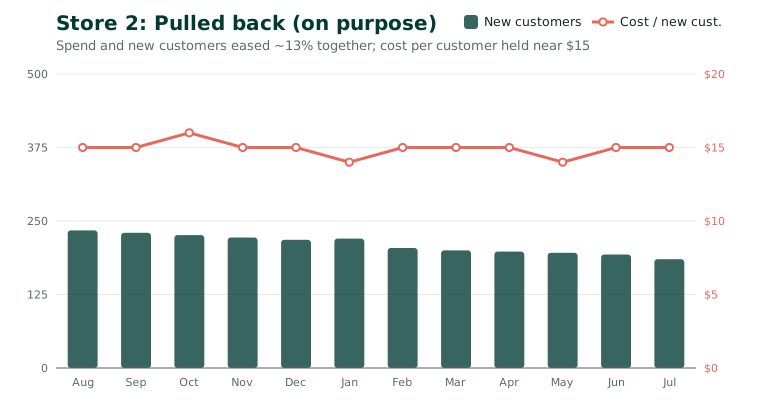 Both dials ease down together and the cost per customer holds near $15. A pullback on the numbers, planned in reality.
The second store looked worse at first. The verdict was “Pulled back,” with both spend and new customers down about 13%.
Mechanically, that’s a pullback. But it was intentional. The store was optimizing for efficiency, so spend and new customers declined together. That’s not a failure.
Acquisition cost was about $15 against a customer value of $56, so there was still “Room to grow” when the business was ready to push again.
This shows the limit of any simple tool: it reads the numbers; you supply the intent. The calculator saw both metrics falling together. It couldn’t know that efficiency was the goal.
Store Three: When the Tool Is Wrong
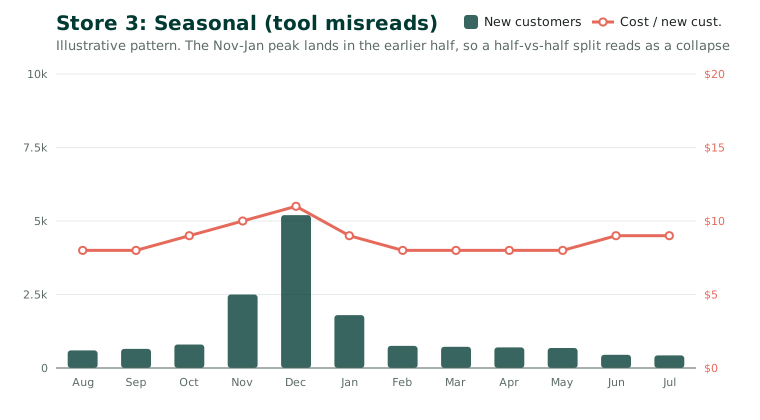 Illustrative pattern. The November-to-January peak lands in the earlier half, so a first-half-versus-second-half split reads a strong year as a collapse.
The third store has a heavy November-to-January peak and a major promo period. The verdict came back “Pulled back,” with dramatic declines.
Here, the badge is misleading. The calculator compares the first six months with the last six, but it doesn’t understand seasonality. Because peak season falls in the earlier period, the second half looks like a collapse even though the store’s peak actually grew.
For a seasonal business, compare peak season with the previous peak season, not one half of the year with the other.
So don’t change budgets on a seasonal or promo-heavy store based on the badge alone. What remains useful is the month-to-month relationship between new customers and acquisition cost.
Treat It as a First Read
Run this on your store and you’ll get a quick answer to an important question: Is more ad spend bringing in new customers, or just more orders from existing ones? Watch new customers, not just ROAS. Watch marginal cost, not just the average.
But treat the verdict as a first read, not a budget decision. It works well for straightforward stores, needs context for others, and can mislead on seasonal or promo-heavy accounts. Use it to see where to dig deeper.
For the full walkthrough, including the exact prompts and all three stores, watch the video here: youtube.com/watch?v=qLhNw7wGuYQ
If the result is unclear, I’ll run a full growth check for you, free of charge. It goes deeper into seasonality, promotions, brand versus non-brand, and where growth is actually slowing. Run the free calculator and use the link at the bottom to request the full check.
Is your Google Ads spend bringing in more new customers, or just more orders from the ones you already had?
Andrey Kisselev is the founder of Addi Marketing, running done-for-you Google Ads, Merchant Center, and Microsoft Ads for ecommerce brands doing $0.5M to $10M a year.

Andrey Kisselev
With over 10 years managing 50+ accounts, he helps brands and DTC stores grow revenue efficiently through hands-on Google Ads management and practical advice.